

The Morning Signal | July 20, 2026
The dominant overnight impulse is stagflationary rather than conventional risk-off.
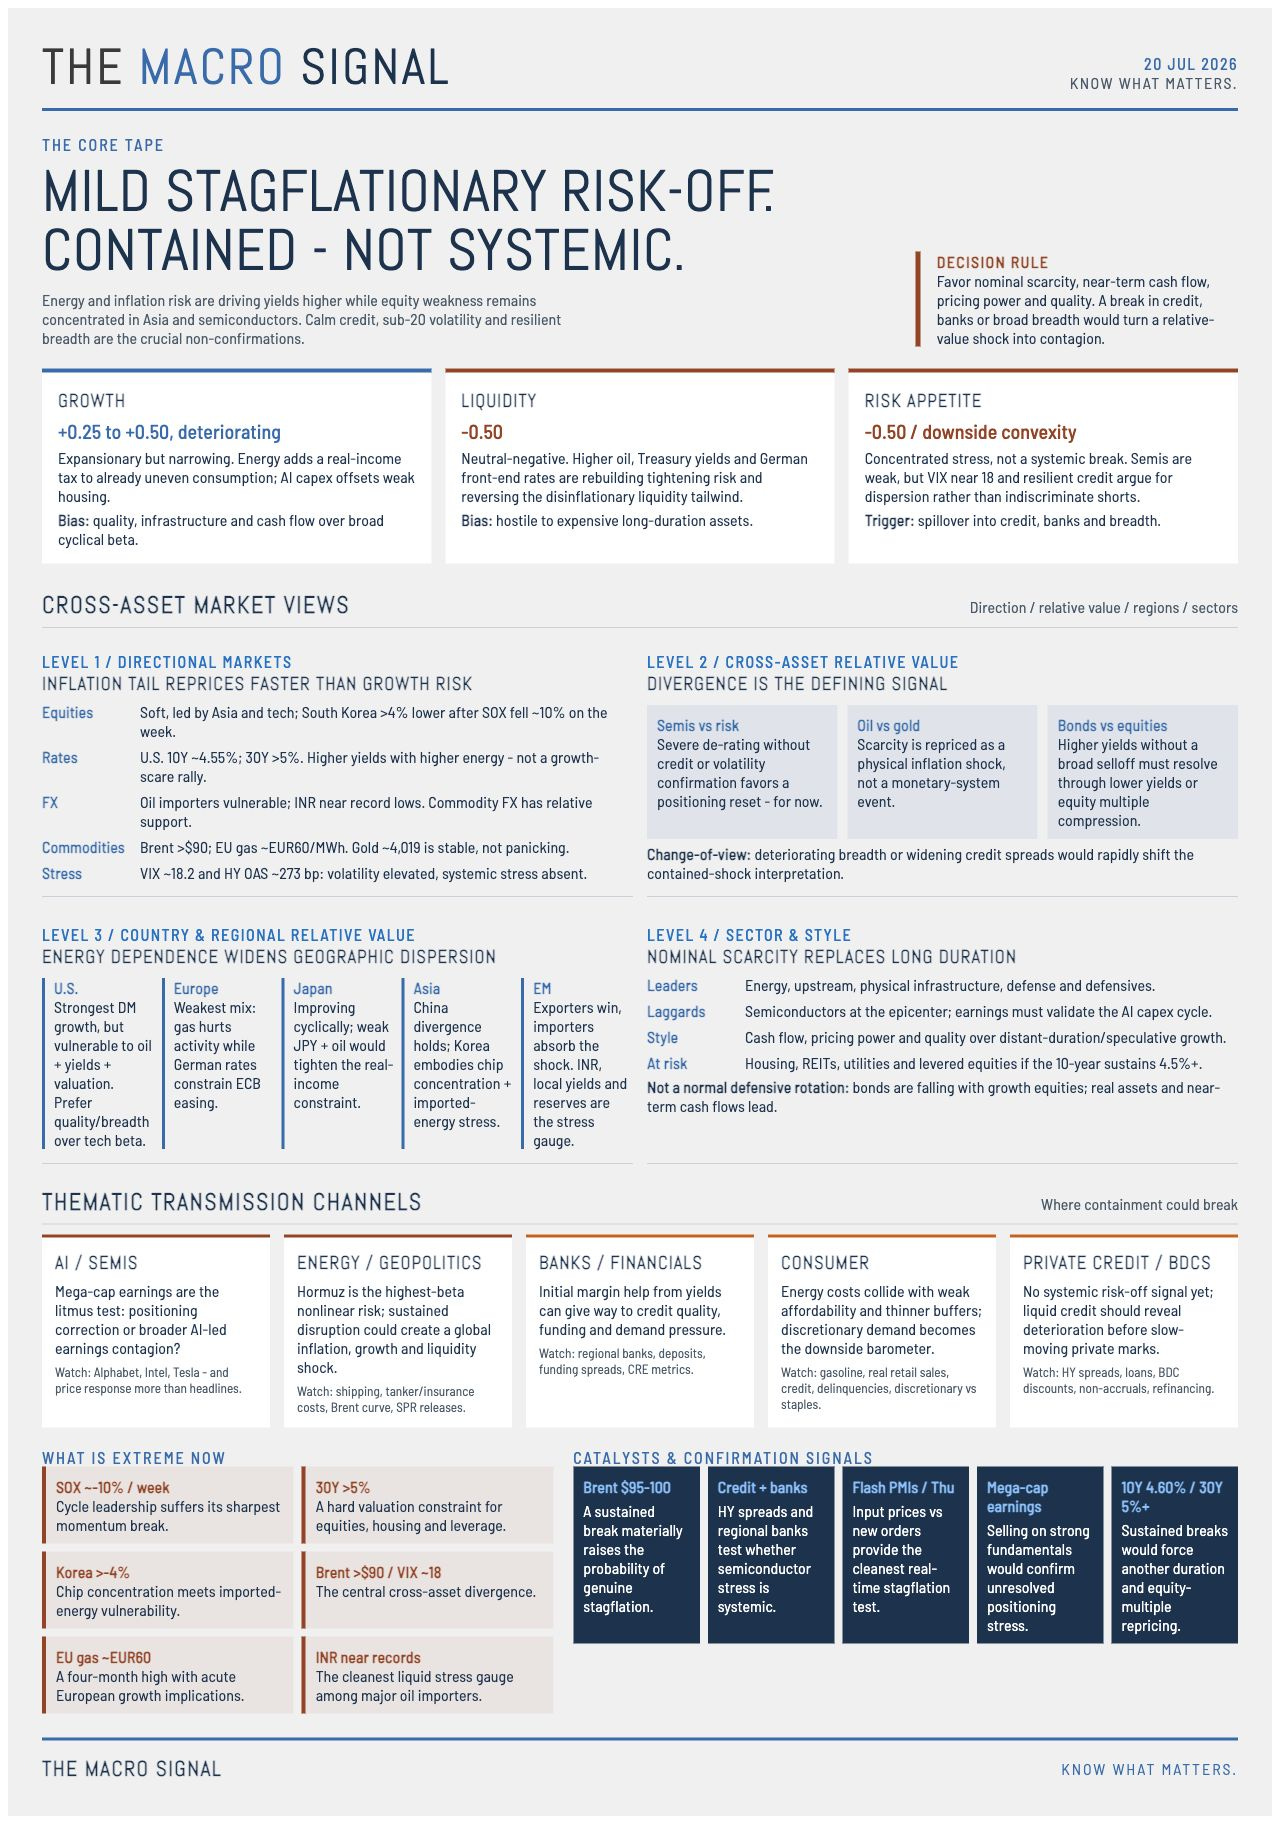
The Core Tape: The dominant overnight impulse is stagflationary rather than conventional risk-off.
Renewed Gulf escalation has pushed Brent back above $90 and European gas toward €60/MWh, while U.S. 10-year yields are around 4.55% and the 30-year is above 5%.
Equities are subdued rather than disorderly because energy is offsetting weakness elsewhere
But the bond market is increasingly pricing an adverse inflation impulse.
Overall: The market is transitioning toward a mild stagflationary risk-off regime, driven by the intersection of higher energy prices, rising inflation tails, and elevated long-term yields—but the absence of meaningful confirmation from credit, volatility, and broader equity breadth argues that the shock remains contained rather than systemic. The critical question is whether the semiconductor correction and energy shock remain isolated relative-value events or begin propagating through credit, earnings expectations, consumer demand, and global financial conditions; until that confirmation arrives, favor nominal scarcity, cash flow, pricing power, and quality over concentrated long-duration growth and rate-sensitive assets.
Top-Down Macro Environment
Growth - Positive, narrowing; incremental downside risk
Current read: Real activity remains expansionary, particularly in the U.S. However, Growth Breadth (
G.BR) is materially weaker than aggregate data suggest.What’s changed: The energy shock creates a new real-income tax and raises the probability that previously resilient consumption weakens over the coming quarter.
Confirmation/conflict: Strong investment and AI capex conflict with weak housing and increasingly uneven consumption. Global growth remains steady but uneven; the IMF currently projects approximately 3% global growth for 2026. IMF
Trading implication: Maintain positive exposure to growth, but prefer quality, infrastructure and cash-flow businesses over broad cyclical beta.
G-Growth Score: +0.25 to +0.5, deteriorating.
Liquidity - Neutral-negative
Current read: Real excess liquidity had been improving (through attenuating inflation), but the renewed energy shock is reversing part of that improvement through higher nominal yields, and potentially higher inflation expectations.
What’s changed: Markets are rebuilding central-bank tightening risk rather than pricing a policy cushion against the geopolitical shock.
Confirmation/conflict: Higher oil + higher Treasury yields + higher German front-end yields all confirm tightening financial conditions. The conflict is that equity volatility remains relatively contained.
Trading implication: This remains hostile to the most expensive long-duration assets. Avoid treating softer backward-looking inflation data as equivalent to an imminent broad easing cycle.
L-Liquidity Score: -0.5.
Risk Appetite - Neutral-negative, concentrated stress
Current read: Risk appetite has deteriorated sharply in AI/semiconductors but has not broken systemically.
What’s changed: The technology unwind is now interacting with a genuine macro inflation shock.
Confirmation/conflict: Semiconductor weakness is severe, but VIX near 18 is remarkably well-contained. Energy remains strong and there is not yet evidence of indiscriminate liquidation spilling over into other sectors.
Trading implication: Favor dispersion over outright market shorts. The key regime trigger signal is whether semiconductor weakness spreads into credit, banks, and broad market breadth.
R-Risk Appetite - Score: -0.5, with downside convexity.
Cross-Asset Market Views
Overall Market View: The market is transitioning toward a mild stagflationary risk-off regime, but the absence of meaningful confirmation argues that the shock remains contained rather than systemic. Watch for propagation signals through credit, earnings expectations, consumer demand, and global financial conditions for indications of a deeper contagion unfolding.
Level 1 — Directional Markets
A mild stagflationary risk-off regime is emerging, with energy and inflation risk driving yields higher even as equity stress remains concentrated rather than systemic. Credit and volatility remain notably calm, arguing against broad deleveraging—for now.
Equities: Risk tone is soft, led by Asia and technology.
South Korea’s chip-heavy market fell more than 4% overnight after the Philadelphia Semiconductor Index lost roughly 10% last week.
The important distinction remains AI/semiconductor liquidation versus generalized macro liquidation
Thus far, the evidence favors narrow and contained liquidation, although the oil shock raises the probability of contagion.
Rates: The adverse move is higher nominal yields alongside higher energy—not a growth scare rally.
The U.S. 10-year is around 4.55%, the 30-year above 5%, and German front-end yields have risen as markets rebuild ECB tightening risk.
This is the clearest cross-asset signal this morning: the market is repricing the inflation tail more aggressively than the growth tail.
FX: Dollar direction is less decisive than the rates/commodity signal. The cleaner expressions are within FX.
Energy importers are vulnerable, with the Indian rupee near record lows after its largest weekly decline since May.
Commodity-linked currencies should have relative support if crude remains elevated.
Commodities: Oil is the macro fulcrum.
Brent has traded above $90 as renewed attacks and constrained Strait of Hormuz shipping revive physical supply fears.
European gas has reached a four-month high near €60/MWh.
Gold around $4,019 is notably stable rather than surging - a sign that the immediate shock is being transmitted primarily through energy and inflation expectations, not yet through wholesale flight-to-safety demand.
Credit & Volatility: Equity volatility is elevated but not signaling systemic stress.
VIX is around 18.2, down roughly 3% from Friday’s indicated level.
That is an important non-confirmation of the geopolitical headlines and technology selloff.
U.S. High Yield OAS are still relatively sanguine, hovering near the tights of ~273 bps.
Overall Regime Read: Mild stagflationary risk-off, but not systemic deleveraging.
Level 2 — Cross-Asset Relative Value
The defining feature of the tape is divergence: semiconductors are selling off without confirmation from credit or broader volatility, while oil is repricing geopolitical scarcity without a corresponding flight into gold. These non-confirmations support a contained-shock interpretation, but deteriorating breadth or widening credit spreads would materially change the signal.
The most important divergence remains semiconductors versus the broader risk complex. Credit and equity breadth are the key signals to monitor for a change-in-view.
A roughly 10% weekly collapse in the Philadelphia Semiconductor Index would ordinarily generate materially greater volatility and cross-asset stress.
Instead, VIX remains relatively sanguine and subdued, below 20 and energy equities are providing a bit of an offset.
If credit and broader equity breadth continue to hold up, then the semiconductor move increasingly looks like it is a concentrated positioning/valuation reset.
However, if credit begins to weaken, the interpretation changes quickly.
The second divergence is gold versus oil.
Oil is aggressively re-pricing geopolitical scarcity while gold has remained largely stationary.
That argues that markets currently see the Gulf escalation primarily as a physical commodity and inflation shock, rather than a monetary-system or acute financial-stability event.
The third key divergence is bonds versus equities.
Rising yields have not yet generated an equivalent broad equity selloff (breadth remains generally healthy).
That can resolve through either lower yields or equity multiple compression.
But with oil above $90 and the long end already under pressure, the near-term asymmetry is growing increasingly less comfortable for rich duration-sensitive equity groups (e.g., Tech, Utilities, Housing/Homebuilders, MLPs, REITs, etc.)
Level 3 — Country and Regional Relative Value
The energy shock is widening geographic dispersion, favoring economies with stronger growth and energy independence while pressuring energy importers already facing weak growth or external vulnerabilities. Europe faces the most adverse macro mix, while Asia and EM increasingly divide along semiconductor exposure and energy-dependence fault lines.
United States: strong but increasingly vulnerable.
Still the strongest major DM growth backdrop, but increasingly exposed to a collision between higher oil, higher long yields and elevated equity valuations.
Prefer U.S. quality/breadth over concentrated technology beta.
Europe: The weakest macro combination.
Higher European gas prices simultaneously weaken real activity and complicate ECB easing.
German two-year yields reaching a two-year high is a particularly adverse signal for rate-sensitive European assets.
Japan: Cyclically improving, but vulnerable to imported-energy deterioration.
Watch JPY behavior closely: continued currency weakness alongside higher oil would tighten Japan’s real-income constraint.
Asia: China Holds Its Divergence as Asia Absorbs the Shock Through Tech and Energy Exposure
China’s domestic/external divergence remains intact, but Asian markets are being disproportionately hit through semiconductor concentration and energy-import dependence.
South Korea’s >4% decline is the clearest overnight manifestation.
EM: Divergence Widens as Higher Oil Rewards Exporters and Stresses Import-Dependent Economies
The key distinction is energy exporters versus importers.
The key fault line across EM is increasingly energy exposure, with higher oil prices improving external balances for exporters while simultaneously tightening financial conditions for large importers.
India is a useful stress indicator: oil approaching $95 has pressured INR toward record lows and lifted sovereign yields despite significant foreign bond inflows. Watch whether INR weakness and sovereign yields continue rising despite strong foreign bond inflows, which would signal that the terms-of-trade shock is beginning to overwhelm supportive capital flows.
More broadly, monitor EM FX dispersion, local-rate repricing, sovereign spreads, and reserve drawdowns for evidence that the oil shock is broadening from relative-value divergence into more generalized EM stress.
Level 4 — Sector & Style
Nominal scarcity is replacing long-duration growth as the dominant leadership theme, favoring energy, defense, cash flow, pricing power, and quality while pressuring semiconductors and rate-sensitive assets. This is not a conventional risk-off rotation: bonds are falling alongside growth equities, making real assets and near-term cash flows the relative winners.
Leadership: Energy + Defensives
Energy, upstream producers and physical infrastructure remain the cleanest beneficiaries.
Defense retains structural support from geopolitical escalation.
Laggards: Semis are the epicenter, all eyes on earnings.
Semiconductors remain the epicenter of current market turbulence.
The critical question this week is whether mega-cap earnings validate the AI capex cycle strongly enough to stop stocks falling on fundamentally good news.
Style: favor cash flow and pricing power over growth.
The current tape favors cash flow and pricing power over distant-duration growth.
Quality should outperform speculative Growth, if yields remain elevated.
Cyclicals-vs-Defensives: not a typical rotation.
This is not a conventional defensive rotation because energy is leading and bonds are selling off.
The better characterization is nominal scarcity leadership.
Rate-sensitive assets: vulnerable to the backup in term yields.
Housing, REITs and highly levered equities face renewed pressure if the 10-year remains around 4.5%+.
Thematic
AI / semiconductors: mega-cap earnings will serve as the litmus test for containment-vs-contaigon.
Mega-cap earnings are the key test of whether the semiconductor selloff remains a positioning correction or evolves into broader AI-led earnings contagion.
The SOX’s roughly 10% weekly decline is now the central positioning event.
Upcoming results from Alphabet, Intel and Tesla will test whether the correction remains isolated or spreads into broader earnings expectations.
Energy / geopolitics: Highest macro beta theme.
Hormuz remains the market’s highest-beta nonlinear risk, with sustained disruption threatening to turn an energy shock into a global stagflationary and liquidity event.
The Strait of Hormuz disruption remains the key nonlinear variable; roughly 20% of global oil supply normally transits the strait.
Any sustained impairment would likely transform the current energy shock into a broader global inflation, growth, and liquidity shock, with the greatest pressure falling on energy-import-dependent economies.
Watch physical shipping flows, tanker rates and insurance costs, the Brent curve, and signs of strategic reserve releases for early confirmation that disruption is moving from geopolitical risk premium into actual supply impairment.
Banks/financials:
Higher long yields can initially help margins, but a persistent stagflation shock eventually dominates through credit quality and slower demand. Regional banks remain a useful contagion indicator.
Yield support is giving way to credit-cycle risk. Higher long-end yields can initially support net interest margins, but that benefit becomes increasingly secondary if the shock persists and begins to weaken credit quality, loan demand, funding conditions, and asset values.
Regional banks remain the cleanest contagion indicator: watch deposit outflows, funding spreads, CRE-sensitive credit metrics, and relative underperformance versus larger diversified banks for signs that macro stress is becoming balance-sheet stress.
Consumer: The incremental setup is deteriorating.
The consumer is becoming an increasingly important downside barometer as renewed energy pressure collides with constrained affordability and diminishing household buffers.
Higher gasoline and energy costs arrive while housing affordability remains constrained
Discretionary consumption is therefore an increasingly useful short-side macro barometer.
Private credit/BDCs: No clear systemic “risk off” signal yet.
No systemic risk-off signal yet, but widening liquid credit spreads would be the critical confirmation that equity volatility is evolving into broader credit-cycle stress.
Private marks are inherently slow-moving, so the more important near-term confirmation signal is whether stress begins to appear in liquid credit markets rather than waiting for reported NAVs to deteriorate.
Watch U.S. high-yield spreads, leveraged-loan prices, BDC discount-to-NAV moves, non-accrual trends, and refinancing activity for evidence that equity volatility is being validated by a broader deterioration in credit conditions.
What’s at an extreme
Semiconductors: Roughly -10% over one week for the Philadelphia Semiconductor Index is the clearest market extreme and an unusually violent de-rating for the cycle’s leadership group.
Long-end yields: The U.S. 30-year above 5% represents an important valuation constraint across equities, housing and leveraged assets.
German front-end rates: Two-year yields at approximately a two-year high show how rapidly the oil shock has changed Europe’s policy distribution.
Indian rupee: Near record lows, making INR one of the cleanest liquid indicators of stress among major oil-importing economies.
Oil versus volatility: Brent above $90 while VIX remains around 18 is itself an extreme cross-asset divergence worth monitoring.
What’s moving in an extreme way
Semiconductors: ~10% weekly decline; the most important momentum break in global equities.
Korean equities: >4% overnight decline, combining semiconductor concentration with imported-energy exposure.
Oil: Renewed upside acceleration above $90 as physical shipping risk returns.
European gas: Four-month high near €60/MWh, potentially more consequential for European relative growth than crude itself.
Rates: The simultaneous rise in oil and global bond yields represents a regime shift away from the benign disinflation narrative that dominated the recent macro data.
Watch next
Brent $95–100: a sustained break would materially increase the probability of a genuine stagflation regime rather than a temporary geopolitical premium.
Credit confirmation: HY spreads and regional banks are the key test of whether the semiconductor unwind is becoming systemic.
Global flash PMIs Thursday: focus especially on input prices versus new orders—the cleanest real-time test of stagflation.
Mega-cap/AI earnings: watch the price response more than the headline numbers; continued selling on strong fundamentals would signal unresolved positioning stress.
U.S. 10-year 4.60% / 30-year 5%+: sustained breaks higher would likely force another equity-duration repricing.